Metrics
Figure 1: Total Reports Received in Last Four Years
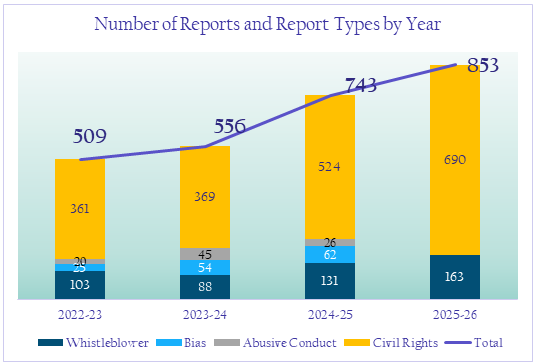
Figure 1 shows a 9% increase from FY23 to FY24, and a much more significant 34% increase from FY24 to FY25, slowing to a 15% increase to FY26. A factor in the 34% jump from FY24 to FY25 was the new systemwide Anti-Discrimination Policy issued in February 2024; that Policy shifted the responsibility for addressing student complaints of discrimination from SCAIP to the Office of Civil Rights, resulting in increased complaints. A factor in the 15% increase in FY26 was the opening of new on-campus housing in Fall 2025, adding 1,568 student beds to campus. The trend of increased reports is not unique to UCR—we see this throughout the UC system and across the country.
Note: Data for the most recent year (FY26) does not yet reflect the breakdown of abusive conduct and bias reports.
Figure 2: Formal Investigations Initiated – Count and Classification
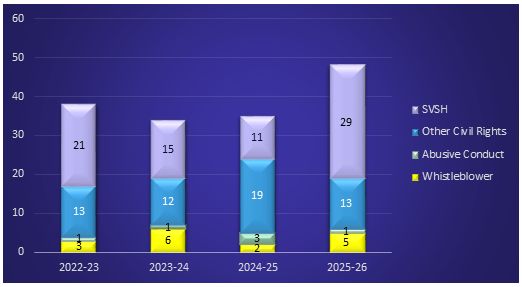
Figure 2 groups investigations by the year in which they were initiated. Investigations are also categorized by the policy primarily at issue. Our investigations have hovered around 35 per year for many years. Last year (FY26) saw a significant increase, jumping to 48.
Figure 3: How Many Investigations Substantiate Misconduct?
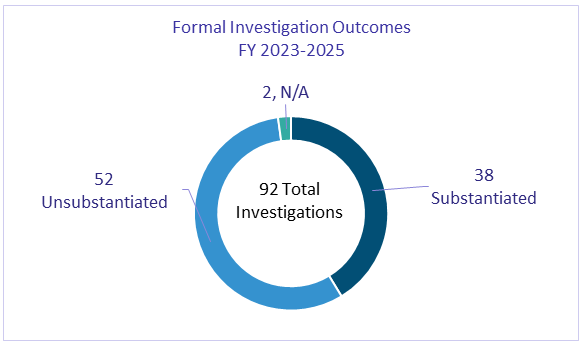
Figure 3 shows the number of formal investigations that substantiated a policy violation. Some investigations look into multiple potential policy violations; if the investigation finds misconduct for one of the alleged policy violations, it will be reflected in this figure as “substantiated,” even if other allegations are not. Note this figure has not been updated to include the most recent year (FY26).
Figure 4: Anonymous Whistleblowing
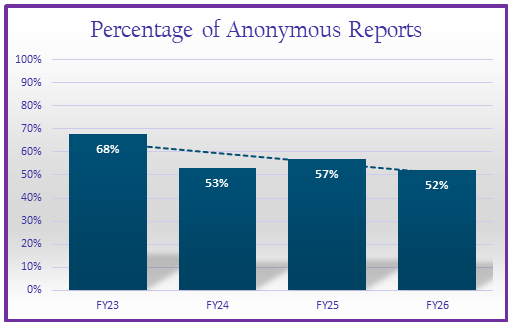
A “speak up” culture must allow for anonymous reporting. We hope that most reporters feel able to report directly and openly, but even in the most healthy workplace some reporters fear retaliation. We are pleased that the percentage of anonymous reporting has remained just over 50%, down from a high of close to 70% three years ago (FY23).
Note that for some reports initially made anonymously, the complainant/reporter later identifies themselves. These reports would still be classified as anonymous.
Figure 5: Types of Whistleblower Allegations Investigated
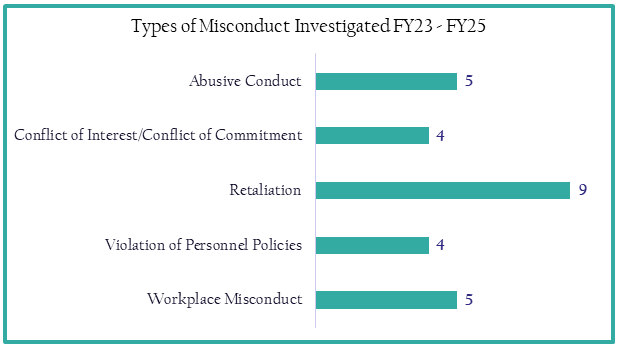
Figure 5 shows the types of allegations that were addressed through a formal investigation in the previous three academic years. A formal investigation involves notices of investigation issued to the parties, interviews and other evidence collection and review, and production of an investigation report, all following procedural steps designed to provide full due process to those involved. Note that the retaliation category includes some complaints processed under the UC Whistleblower Protection Policy.
Figure 7: Number of Reports Received by Office of Civil Rights (OCR) FY22-26
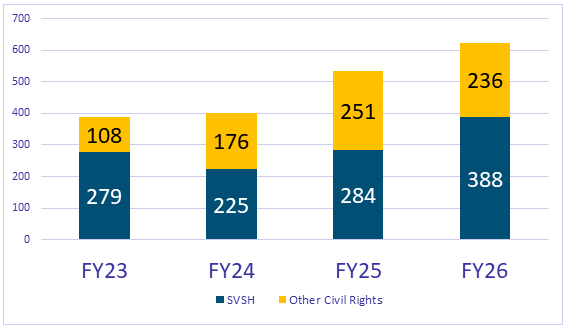
Most of the complaints and reports received by the Compliance unit come to the Office of Civil Rights. This figure shows that the number of reports has increased each year, although last year we received fewer non-SVSH (“other civil rights”, such as complaints of racial harassment and disability-based discrimination) reports compared to the previous year.